All Delaware places > Sussex County > Greenwood
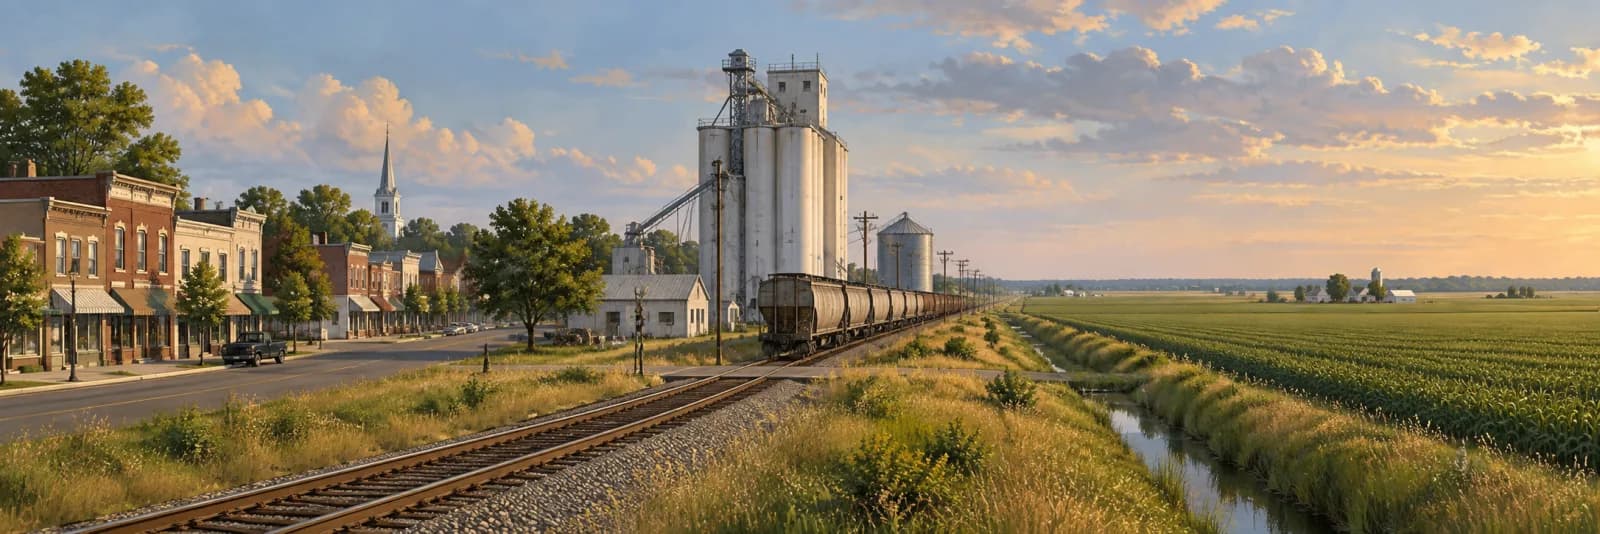
An editorial illustration of Greenwood, Delaware
Sussex County · Delaware incorporated municipality

Greenwood, DE

Projected to grow to 1,291 residents by 2050, a 17% increase from the current municipal estimate.

Population
1,100
DPC official estimate
Local jobs
520
LODES workplace jobs
Median income
$73,345
ACS 5-year estimate
School locations
1
FirstMap site count
City overview

The forces shaping Greenwood now.

A missing measure is unavailable coverage, not zero or an absence claim.

01
Population outlook

Greenwood's long-range population path stands out.

The Delaware Population Consortium projects 1,291 residents in 2050, a 17% change from its 2024 municipal estimate. This is a planning projection, not an observed outcome.

2024 estimate: 1,100 · 2050 projection: 1,291

Source: dpc projections 2024 · 2050 ↗.
02
People

Greenwood has a distinct household profile.

44% of occupied homes are owner-occupied in the latest population and housing record.

Owner-occupied: 44%

Source: census acs5 2024 · 2024 ↗.
03
Daily life

Greenwood has its own public library branch.

Greenwood Public Library together cover 10,400 square feet of public library space inside the boundary.

Branches: 1

Source: IMLS Public Libraries Survey (PLS), outlet file, checked 2024.
04
Daily life

Greenwood has a well-stocked restaurants directory.

5 listed restaurants locations appear inside the boundary—directory records, not a ranking or completeness claim.

Restaurants: 5

Source: Overture Maps Foundation, checked 2026-08-19.0.
People

Who lives here—and which households shape demand?

Population uses Delaware's official Population Consortium estimate, which does not carry the ACS survey's sampling error for small places. Households and other figures below remain ACS survey estimates.

Population
1,100

Delaware Population Consortium official estimate

Source: dpc projections 2024 · 2024 ↗
2050 population projection
1,291

Planning projection, not an observed outcome

Source: dpc projections 2024 · 2050 ↗
Households
648
Source: census acs5 2024 · 2024 ↗
Median age
33
Source: census acs5 2024 · 2024 ↗
Median household income
$73,345
Source: census acs5 2024 · 2024 ↗
Bachelor's degree or higher
17%

Among residents age 25 and older. ±11% margin of error.

Source: census acs5 2024 · 2024 ↗
Population composition

Residents by Census category

Each share uses the total Greenwood population as its denominator. Hispanic or Latino may be of any race; the other broad categories are non-Hispanic. Detailed Asian-alone groups use a separate Census race table.

White, non-Hispanic56%
Black, non-Hispanic31%
Hispanic or Latino8%
Two or more races, non-Hispanic4%
Filipino0%

Sources: census acs5 2024 · 2024 ↗; census acs5 2024 · 2024 ↗. Positive detailed Asian estimates are shown in this same composition list; published zeroes are omitted and are not proof of absence. Small differences may be within ACS survey uncertainty.

Source: dpc projections 2024 · 2024 ↗. ACS estimates cover a five-year survey period; margin of error is reported where provided.

Work

What work is located inside Greenwood?

LODES counts jobs by workplace location, not the industries of residents or a named-employer roster. The sector mix can show the shape of the local job base, not dependence on individual companies.

Jobs by sector

Latest LODES workplace-job estimates. Shares use the total local job count. Commuter-flow context (who works here vs. lives here) is intentionally omitted until the Delaware panel can identify scoped destinations without overstating cross-border precision — see real work-destination distances in the Mobility section below.

Education121
Finance104
Logistics / industrial70
Healthcare & social assistance64
Manufacturing46
Retail38

Source: lodes8 wac de 2023 · 2023 ↗.

Housing

What kinds of homes exist—and where is pressure visible?

Housing estimates describe existing conditions. Permit and development records signal reported activity, not starts, completions, or a complete construction census.

Owner-occupied
44%
Source: census acs5 2024 · 2024 ↗
Median owner value
$252,200
Source: census acs5 2024 · 2024 ↗
Vacancy rate
6%
Source: census acs5 2024 · 2024 ↗
Two-bedroom rent benchmark
$1,498
Source: hud fmr 2027 · 2027 ↗
Owner-home values

A Census estimate, not a market price

These estimates cover owner-occupied homes only. They are not listings, sales, appraisals, or an all-homes measure; the final Census band is open-ended at $2M+.

Median estimate$252,200
Middle half of homes$199,700–$296,400Lower to upper quartile of owner estimates
Luxury-home concentration1%Estimated at $2M+
Under $500k96%
$500–749k2%
$750–999k0%
$1–1.49M0%
$1.5–1.99M0%
$2M+1%

Source: census acs5 2024 · 2024 ↗.

Existing housing mix

Detached homes52%
Attached homes9%
Small multifamily16%
5+ unit multifamily21%
Mobility

What is the scheduled supply—and how do workers usually commute?

GTFS measures scheduled service at stops within the boundary. It is not ridership, reliability, or a guarantee that a particular trip is practical. ACS commute modes are a separate survey estimate.

Typical drive times

About how long does it take to get where people go?

Work destinations are selected from observed resident job flows. These are broad, reviewed planning ranges from representative parts of Greenwood—not live-traffic or door-to-door predictions.

Georgetown

Georgetown is a LODES-selected resident workplace destination for Greenwood, representing 13% of matched resident jobs from this place.

25–50 minWeekday morning peak
Details

Highway-dominant corridor: distance converted with a reviewed 1.25x circuity factor and an assumed 45 km/h peak-effective / 70 km/h off-peak effective speed, then widened and rounded to a broad band. The morning inbound peak is shown; the evening outbound return is assumed to fall within the same broad band.

Seaford

Seaford is a LODES-selected resident workplace destination for Greenwood, representing 13% of matched resident jobs from this place.

20–40 minWeekday morning peak
Details

Highway-dominant corridor: distance converted with a reviewed 1.25x circuity factor and an assumed 45 km/h peak-effective / 70 km/h off-peak effective speed, then widened and rounded to a broad band. The morning inbound peak is shown; the evening outbound return is assumed to fall within the same broad band.

Milford

Milford is a LODES-selected resident workplace destination for Greenwood, representing 12% of matched resident jobs from this place.

20–50 minWeekday morning peak
Details

Highway-dominant corridor: distance converted with a reviewed 1.25x circuity factor and an assumed 45 km/h peak-effective / 70 km/h off-peak effective speed, then widened and rounded to a broad band. The morning inbound peak is shown; the evening outbound return is assumed to fall within the same broad band.

Dover

Dover is a LODES-selected resident workplace destination for Greenwood, representing 9% of matched resident jobs from this place.

50–90 minWeekday morning peak
Details

Highway-dominant corridor: distance converted with a reviewed 1.25x circuity factor and an assumed 45 km/h peak-effective / 70 km/h off-peak effective speed, then widened and rounded to a broad band. The morning inbound peak is shown; the evening outbound return is assumed to fall within the same broad band.

Method, review date, and sources

Planning estimate; actual time varies by departure time, route, traffic, weather, incidents, and closures.

Estimates are derived from reviewed origin/destination coordinates using the same documented distance-to-time heuristic as the Washington pilot (circuity factor and assumed effective speed by corridor type and period), then deliberately widened and rounded to a broad band. No live routing or traffic API was called. Two methodology differences from the Washington pilot, both disclosed: each place uses a single Census TIGER internal point as its representative origin rather than three job-weighted directional sample origins, and work destinations are selected from Delaware's own place-to-place LODES flow file rather than block-level clustering—out-of-state commute flows (aggregated to the Pennsylvania/Maryland/New Jersey state level in that source) are excluded because a state has no single routable coordinate.

Estimates reviewed 2026-09-12. Starting point: Greenwood representative point.

City boundary and regional context● nearby places
Daily life

Institutions and listed activity inside the boundary.

These are bounded inventories, not measures of access, enrollment, foot traffic, or the full local business economy. People routinely use services across place lines.

Local field guide

Places for everyday needs in Greenwood

Care, errands, food, fitness, and personal services gathered into one browsable directory.

Counts reflect current directory records associated with the city, not a complete business census or a measure of access. Large categories show a sample.

Sources: U.S. Centers for Medicare & Medicaid Services (CMS), snapshot 2026-08-13; Overture Maps Foundation, release 2026-08-19.0; U.S. Centers for Medicare & Medicaid Services (NPPES NPI Registry), snapshot 2026-09-12.

Public library footprint

Greenwood Public Library

Floor area shows the scale of the physical branches. The national IMLS outlet file does not report circulation at the branch level, so checkouts are not shown here; people routinely use libraries across city lines.

Branch floor area
10,400 sq ft

All matched branches must report floor area before a city total is shown.

Greenwood Public LibrarySussex County Dept. Of Libraries
100 Mill Street, Greenwood DE 1995010,400 sq ft~45 avg. hours/week

Source: IMLS Public Libraries Survey (PLS), outlet file, 2024. Branches are matched by the outlet's reported coordinate falling inside the place boundary; bookmobiles and books-by-mail-only service are excluded because they have no fixed location.

The schools inside Greenwood.

Institution counts and enrollment remain separate. A school can serve students from outside the place, and residents may attend a school across the boundary or elsewhere in their district.

Public elementary0

None in the current FirstMap place-boundary match.

Public middle0

None in the current FirstMap place-boundary match.

Public high0

None in the current FirstMap place-boundary match.

Other public programs1
  • Woodbridge Early Childhood Education CenterGrades IT02

Public-school names and grade levels come from Delaware Department of Education / Delaware FirstMap ↗.

Civic

Who represents Greenwood today?

State House and Senate districts are drawn independently of municipal boundaries, so a place can span more than one district per chamber.

State legislature

Reflects the current Delaware FirstMap district snapshot; a vacancy, resignation, or mid-term appointment can lag this by a few weeks.

Source: Delaware General Assembly / City of Wilmington, via Delaware FirstMap, checked 2026-09-12.

Greenwood's own government

Delaware has no single statewide directory of every town's mayor, council, and meeting schedule the way Washington's MRSC covers all 82 cities there, so Metroscope does not yet show a roster for Greenwood. Its official town site is the current-best source for that.

Delaware runs one statewide emergency notification system, not a separate one per place; cell phones aren't enrolled automatically. Sign up for Delaware emergency alerts (DEMA) ↗